Mesoscale modeling for consistently superior wind energy project results; giving you the ability to understand your wind energy site resource with high fidelity before measurements are completed
This technical brief provides an overview of high-resolution mesoscale or large-eddy (microscale) weather and wind farm modeling. We review its use as a powerful tool by ArcVera Renewables to help onshore and offshore wind energy projects be more successful in development and financing, and to perform better across their project lifetimes.
When properly applied, better still early in development, and objectively compared to on‐site wind measurements, the use of such weather modeling will help optimize wind farms to improve long-term mean annual (P50) energy production while simultaneously improving project‐specific P‐values by reducing wind-flow-modeling uncertainty. This uncertainty and P-Value benefit is overall and specifically in comparison to other less accurate and therefore less certain modeling techniques, such as computational fluid dynamics (“CFD”), exposure models, mental models, quasi-linear models, and Wind Atlas Analysis and Application Program-style (“WAsP-style”) linear wind-flow methods.
To learn more about mesoscale modeling specifically applied to the offshore environment, please refer to the dedicated article ” Benefits of Mesoscale Modeling for Offshore Wind Energy Projects“.
What is Mesoscale Modeling?
Mesoscale modeling is a numerical weather prediction (“NWP”, also known as weather modeling) technique used to forecast common meteorological variables (e.g., wind, pressure, temperature, humidity, precipitation) within a defined geographical area from the surface of the Earth to typically 20 km deep in the atmosphere. “Meso” scale refers to middle-sized atmospheric phenomena, as opposed to macro-scale atmospheric phenomena like the high and low pressure systems that traverse continents.
All of the aforementioned variables influence winds and wind project site wind flow patterns and the wind speed frequency distribution, and only NWP models forecast them all, providing a fundamental advantage over other modeling techniques.
Mesoscale models were first created in the early 1970s and were greatly modified and advanced at elite atmospheric science universities and research institutions in the 1980s and 1990s.
Nowadays, they are extensively utilized for a wide variety of applications and continue to improve as increased computing power allows greater physical detail to be addressed. In the 1980s and 1990s microscale models, or so-called “large-eddy” simulation NWP models were developed, allowing simulation of detailed atmospheric flow phenomena (many of which are relevant to wind-farm scale wind flow patterns) at scales of less than 100 m.
The modeling is performed by computationally solving the set of non‐linear and thermodynamic equations that represent the time and space evolution of the atmospheric state every second or few seconds. Other modeling techniques used in the wind industry are often steady-state (e.g., CFD), linear and steady-state, or are otherwise lacking the physics, such as strong atmospheric stability or precipitation, required to simulate natural weather conditions, resulting in generally more poor performance relative to NWP modeling.
The standard deviation of error of mesoscale long-term mean annual wind flow modeling results, based on an array of cases with direct comparison to long‐term mean annual hub‐height meteorological-tower wind-speed estimates, is consistently much lower than that of linear and other modeling techniques. Because CFD and WAsP‐style techniques rely specifically on the on‐site measurements rather than data from similar cases, they typically both have much higher wind-flow-modeling uncertainty than that of mesoscale modeling.
In order to determine the accurate long-term wind-flow patterns across the project, with the objectives of optimizing development efficiency, maximizing array efficiency/competitiveness, increasing the likelihood of lifetime performance and de-risk returns, and improving investor confidence, the models used must be able to consistently and accurately predict the wind flow at scales of motion that affect the turbines.
Turbines are commonly spaced side-by-side (“lateral”) within turbine strings at 1.5 to 5.0 rotor diameters (RD), so NWP modeling is most appropriately applied to wind farm applications with resolution (or, formally, grid spacing) of 200-300 m.
Comparatively, despite their relatively small grid spacing (5 m to 20 m), CFD techniques have three distinct limitations when modeling wind flow:
- Wind farms perform throughout their lifetime in “Mother Nature”: in the real-time, varying, non-linear atmosphere with wildly fluctuating stability and weather. Those real-life conditions are not represented by linear, quasi-linear, or steady-state CFD models, as such models are unable to simulate natural weather conditions.
- CFD and other linear techniques utilize data from meteorological towers, which are limited in number and represent large areas of two to 10 km; relying on small samples of data that cover expansive areas of land increases error significantly.
- Even in “simple” terrain, small-scale terrain features and associated non-linear atmospheric physics driven by thermodynamic factors (such as complex stability-driven meteorology, heterogeneous soil moisture and vegetation transpiration, etc.) affect wind flow patterns at +/-0.1 meters per second (“m/s”) or materially and significant energy of ~80 to 100 basis points of capacity factor.
Unlike CFD and WAsP-style techniques, mesoscale (or mesoscale-to-LES) modeling does not rely on data from individual meteorological towers or on‐site meteorological measurements to create wind-flow patterns. Instead, three‐dimensional reanalysis data sets (from governmental agencies around the globe) are used as initial and boundary conditions for the model simulation.
The detailed and sophisticated physics and thermodynamics of the mesoscale model are sufficient to recreate the weather over time and to generate high-fidelity long‐term mean annual hub‐height wind-flow patterns. The initial wind-flow patterns are then biased‐corrected using the long‐term mean annual hub‐height wind speeds from the measurements, and the residual error is quantitatively assessed.
Why Does Mesoscale Modeling Work?
The strength of mesoscale modeling lies in its ability to model or parameterize nearly all of the important non‐linear, thermodynamic, and physical mechanisms that drive in the atmospheric wind flow and variability. Thus, it is better suited than linear models for creating detailed wind-resource maps of project areas, ultimately allowing for optimal siting of turbines as well as reducing micrositing uncertainty.
Achieving these goals requires that mesoscale modeling is performed at horizontal grid resolutions of 300 m, 200 m, or less (though somewhat coarser resolutions may be appropriate for general prospecting or for other specific cases and somewhat finer resolution in very complex terrain or where there are narrow terrain features). These grid resolutions are then downscaled with simpler physics to terrain resolutions of 30 m or 10 m (which are well inside the turbine-pad diameter). Throughout this overview, the term “resolution” is generally used when referring to the spacing of the grids used in mesoscale modeling, which is also formally referred to as “grid spacing.”
Despite the fact that such grid resolutions are necessary for maximum uncertainty reduction, mesoscale models are conventionally used for wind energy with coarse grid resolutions of one kilometer (“km”) or greater; a separate, simpler linear-type model is then used to downscale the model results from the coarse resolution to the advertised high resolution.
This process yields mesoscale results for coarse terrain and often inaccurate raw model results that are linearly adjusted for actual elevation (as opposed to small-scale physics relevant to turbine-scale wind-flow patterns and array optimization) in the downscaling process. While the downscaled map does include details that mimic the local terrain variations (perhaps even to 30-meter granularity), the wind-speed results are still based on physics from the coarse one km-or-greater resolution simulation.
ArcVera’s proprietary high-resolution mesoscale-modeling technique was developed precisely to combat these uncertainty risks. ArcVera also has the capability of mesoscale or microscale modeling with full atmospheric physics with wind flows at sub‐100 m scales before simple physics downscaling occurs. Modeling at horizontal scales of less than 200 m, down to 50 m or smaller, requires the use of so-called “large-eddy simulation” (“LES”) techniques, which ArcVera has incorporated into its high-resolution mesoscale-modeling system.
ArcVera usually uses 200-m grid spacing before downscaling to a 30-m wind-map resolution, and this is part of our typical model set up (among 300 model parameters) for a bankable wind energy resource assessment, if such modeling hasn’t been taken advantage of earlier in the development timeline.
Mesoscale modeling: Application to wind energy
Given the non‐linear nature of the equations that determine how the wind blows (referred to as “governing equations” in the field of atmospheric science and which are based on the Navier‐Stokes and associated thermodynamic and other equations), the large number of variables to be accounted for, and the spatial/temporal detail required for the forecast at a specific wind-energy site, mesoscale modeling requires significant computational resources and is typically performed on parallel clusters of computers, i.e., supercomputers.
The wind industry in prior years used mesoscale modeling for three purposes:
- Developing regional-scale wind-resource maps, which are used for high‐level screening of areas to determine viable wind resources (coarse resolution, e.g. NREL wind maps),
- providing surrogate or virtual long‐term reference stations for wind projects, particularly those for which traditional climate reference stations are not suitable or available; and
- forecasting wind at a given wind farm to aid in hour-ahead to day-ahead trading or multi-day-ahead planning of wind farm operations.
Mesoscale models can be configured for many purposes and are versatile; they have specific applications to wind energy that can be particularly valuable in addition to the three listed above. To maximize this potential for versatility, ArcVera has developed a proprietary high-resolution mesoscale-modeling capability that can be custom-designed for a variety of purposes specific to a client’s project.
Specifying the mesoscale-model configuration to address the particular topographic, geographic, and meteorological characteristics of a site is a critical step in the ArcVera mesoscale-modeling process, as doing so almost always generates the best answers for each specific site. Early in the development timeframe an accurate and high-resolution mesoscale wind flow map can reduce the total investment in meteorological measurement stations and landowner leases, due to more reliable land targeting for wind resource and more accurate and optimized early turbine array design. One fewer meteorological measurement site pays for mesoscale modeling many times over – and the mesoscale results can be used throughout development into financing and for post-construction operational assessment.
There are also very large advantages to using high-resolution mesoscale wind flow modeling at the time of financing. In complex terrain, micrositing uncertainty is often the major contributor to overall uncertainty, expressed as “P‐values.” These P‐values are major inputs used by financiers when evaluating and sizing an investment for project debt, tax equity, or hedging in any given transaction.
Micrositing uncertainty arises from the use of a few meteorological measurements within the project area relative to the number of turbines; an insufficient number of point measurements creates uncertainty when assessing the long-term mean annual wind speeds at individual turbine locations.
Past experience has shown that, when properly configured for site-specific details, high-resolution mesoscale modeling can generate accurate long‐term mean annual hub‐height wind-speed maps, which can be quantitatively assessed to reduce micrositing or wind-flow-modeling uncertainty.
This accurate high-resolution mesoscale-modeling wind map, in turn, provides a consistently large return on investment through improved P‐Values (or larger net energy for a given P‐value, e.g., P90, P95, P99, etc.) The accurate long-term mean annual wind-speed maps also help to optimize project design for maximum gross and net P50 energy. Such maps, if accurate, can be used for very targeted prospecting, landowner selection, and other purposes during the development stage.
For this reason, ArcVera recommends utilizing high-resolution mesoscale modeling early in this stage so that development is targeted and efficient. The high-resolution mesoscale-modeling effort generally only needs to be run once, which means that future wind-energy resource assessments will simply incorporate prior mesoscale-modeling wind-map results.
Mesoscale modeling: practical considerations and case studies
Since mesoscale modeling is computationally intense, a number of practical questions must be considered:
● What is the least expensive configuration to minimize uncertainty?
● Does that configuration change with terrain type?
● Does that configuration change with land-use, etc?
The core of the ArcVera Numerical Modeling System is the Weather Research and Forecasting (“WRF”) model, which is a full-physics model that uses three-dimensional finite grid domains. For very high-resolution large-eddy simulations, ArcVera uses the WRF variant called WRF-LES.
Boundary conditions and backgrounds for the runs utilizes reanalysis data from the US National Oceanic and Atmospheric Administration (“NOAA”) and its subdivisions and, more frequently now, the European Centre for Medium-Range Weather Forecasting (“ECMWF”) Reanalysis, Version 5 (ERA5). The high-resolution mesoscale-model simulations are configured using nested domains, with the outermost domain covering a large area (e.g., half of the United States) with coarse resolution, and with the innermost domain focused on the subject wind farm and usually having a 200- to 300-m resolution. This high resolution allows terrain and other surface features relevant to detailed wind-flow structure to be physically represented; without that high resolution, critical terrain and small-scale meteorological flow features cannot be physically simulated.
ArcVera investigates these questions using the proprietary ArcVera Numerical Modeling System, with statistics from several years of operational runs (about 105 project runs with two to 10 met towers per project).
EFFECTS OF DOWNSCALING
Downscaling reduces the model’s 200- to 300-m resolution output to a finer scale. This is necessary due to the fact that running NWP models at 30 m is currently cost- and computationally prohibitive, although costs are expected to decrease significantly within the decade. NWP models resolve features two to 10 times as large as grid spacing; by applying full-atmospheric NWP physics at high resolution, the simple downscaling is less prone to error. The extra detail in the downscaled model wind field is helpful in final turbine placement. See Figures 1, 2, 3, and 4.
Figure 1. Low-resolution (600 m) vs. High-resolution (200 m) Wind Maps: Simple Terrain, No Downscaling
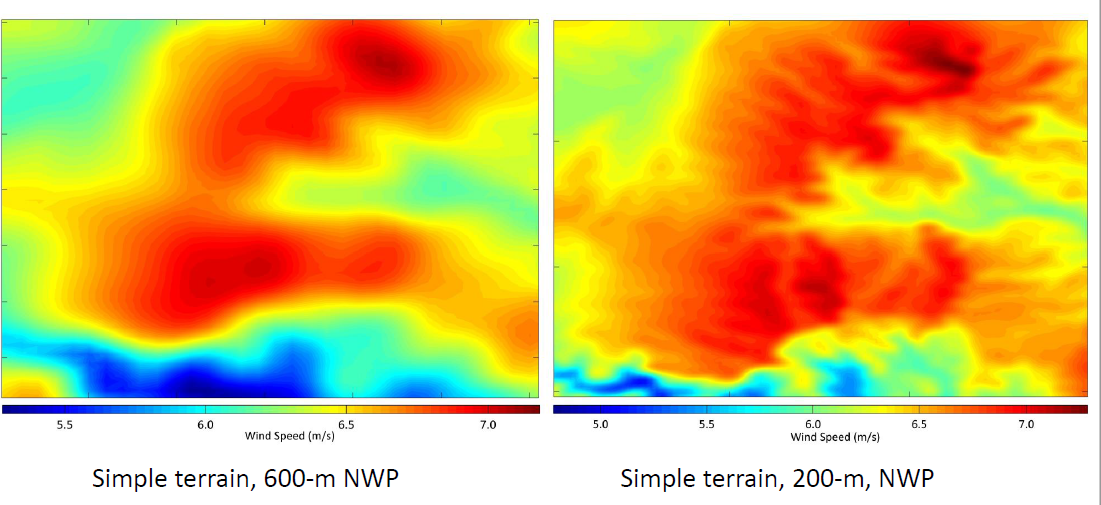
These figures clearly illustrate the increased level of detail that is gained by using higher model resolution. If accurate, the model can show crucially important 0.1+ m/s detail for wind-farm design and WERA accuracy.
Figure 2. Low-resolution (600 m) vs. High-resolution (200 m) Wind Maps: Simple Terrain, Downscaled
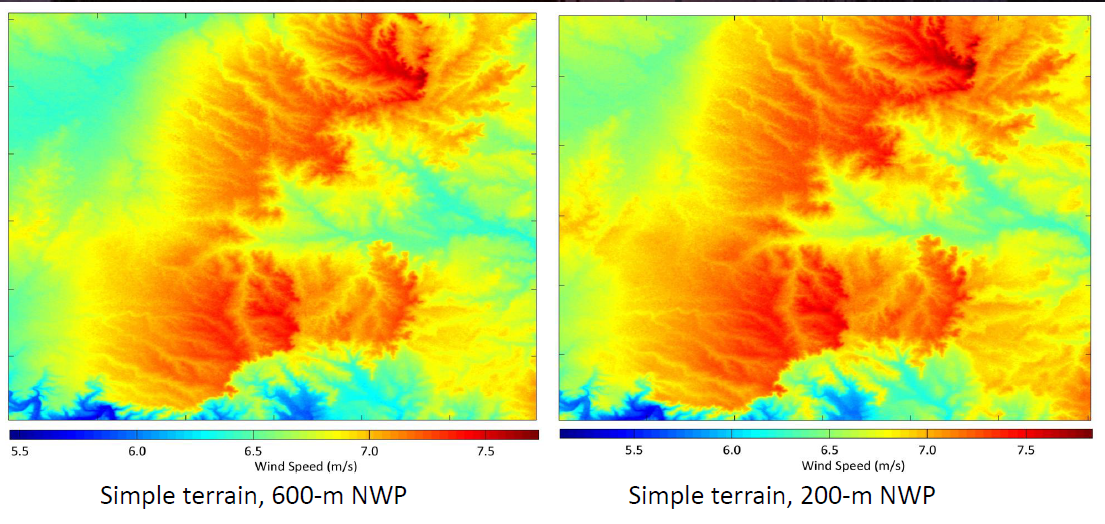
Downscaling to higher resolution provides more detail in the wind field even when already starting from a higher-resolution model domain, but 200-m grid spacing results are more accurate than those from the 600-m resolution simulation.
Figure 3. Low-resolution (900 m) vs. High-resolution (300 m) Wind Maps: Complex Terrain, No Downscaling
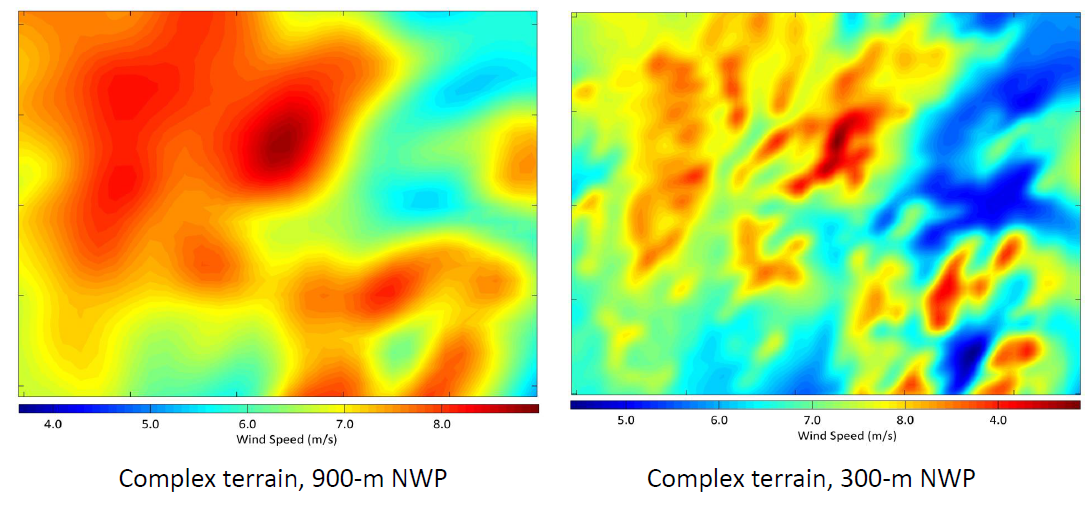
Using higher-resolution model domains in complex-terrain situations is even more important, as wind-speed changes across the modeled domain are even greater than in simple terrain. Small-scale ridgelines or hills are not resolved in the lower-resolution run (900 m) but are identified in the higher-resolution wind field (300 m). The contrast is stark.
Figure 4. Low-resolution (900 m) vs. High-resolution (300 m) Wind Maps: Complex Terrain, Downscaled
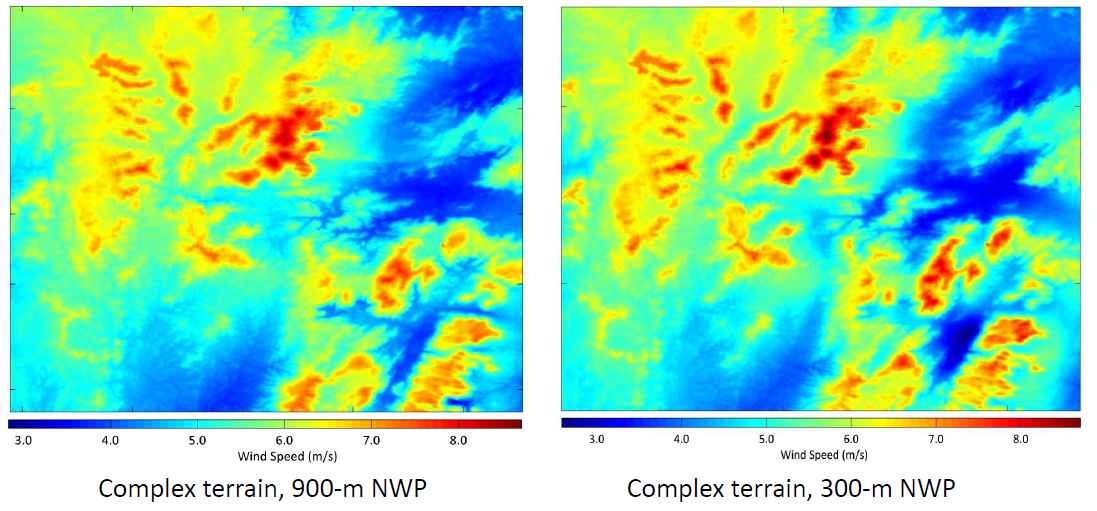
Although downscaling does help to improve the level of detail in the low-resolution wind field, the structure in the higher-resolution run is still much clearer. This additional level of detail is at the 0.1 to 0.5 m/s (100 to 500 basis points of capacity factor) level and is extraordinarily useful in accurate optimized array design, energy assessment, and project planning.
NWP Wind-Speed Accuracy to Met-Tower Measurements vs. NWP Resolution
ArcVera’s high-resolution NWP model reproduces wind flow with improved accuracy with increasing resolution, as shown in Figure 5.
Figure 5. Mesoscale Model Wind-Speed Accuracy
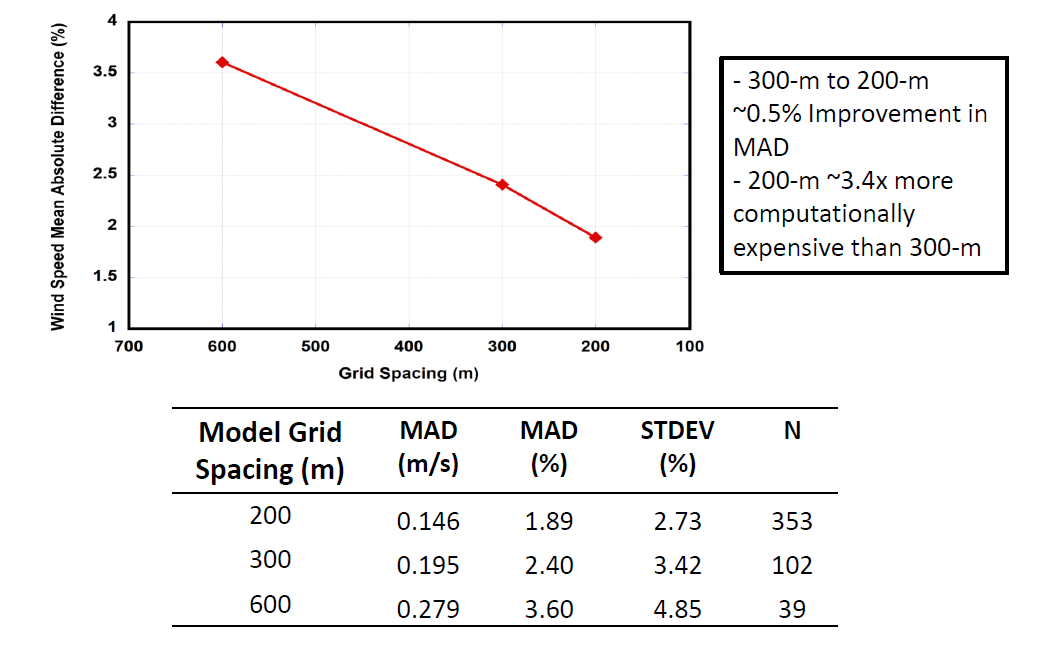
Terrain Complexity Wind-Speed Accuracy
This section reports on results regarding the accuracy of high-resolution mesoscale modeling as terrain complexity increases, as seen in Table 1.
For a given wind farm project area, ArcVera define terrain complexity as follows:
1. Simple: Topographic elevation variation (“TEV”) <25 meters
2. Moderate: TEV 25 to 75 meters
3. Complex: TEV >75 meters
Table 1. Terrain Complexity and Wind-Speed Accuracy, All Resolutions
| Terrain Complexity | MAD (m/s) (1) | MAD (%) | STDEV (%) (2) |
N (3) |
| Simple | 0.116 | 1.44 | 2.07 | 182 |
| Moderate | 0.143 | 1.79 | 2.46 | 140 |
| Complex | 0.236 | 3.08 | 4.17 | 183 |
(1) Mean Absolute Deviation (“MAD”)
(2) Standard Deviation (“STDEV”)
(3) Number of Samples (“N”)
Wind-Speed Accuracy Based on Model Resolution and Terrain
Table 2 shows improved terrain performance with improving resolution, both in simple and complex terrain, using ArcVera’s NWP model.
Table 2. Wind-Speed Accuracy Based on Model Resolution and Terrain Complexity
| Terrain Complexity | Model Grid Spacing (m) | MAD (m/s) | MAD (%) | STDEV (%) | N |
| Simple | 200 | 0.101 | 1.22 | 1.63 | 137 |
| Simple | 300 | 0.140 | 1.78 | 2.81 | 26 |
| Simple | 600 | 0.199 | 2.69 | 3.79 | 13 |
| Moderate | 200 | 0.136 | 1.71 | 2.28 | 100 |
| Moderate | 300 | 0.168 | 2.09 | 2.99 | 33 |
| Moderate | 600 | 0.055 | 0.64 | 0.91 | 2 |
| Complex | 200 | 0.209 | 2.84 | 3.91 | 116 |
| Complex | 300 | 0.251 | 3.03 | 4.06 | 43 |
| Complex | 600 | 0.341 | 4.35 | 5.58 | 24 |
For comparison, linear and CFD models are reported in the literature with simple terrain standard deviations of 4%, and complex terrain 10%, compared with observations. ArcVera’s high-resolution mesoscale wind-flow modeling system reproduces wind flow with improved accuracy and increasing resolution. For a given terrain complexity, accuracy improves as the resolution improves, with significant improvement shown in both simple- and complex-terrain cases (though the NWP model is less accurate when faced with the more difficult problem of increasing terrain complexity). Independent comparisons between high-resolution mesoscale modeling, CFD, and other wind-flow-modeling techniques show that high-resolution mesoscale modeling consistently outperforms.
Model Wind-Speed Accuracy: Land Use
ArcVera’s high-resolution mesoscale modeling system again shows improved accuracy with increasing resolution and less accuracy as surface roughness increases. The model is more accurate in grassland/shrubland than in forested areas, as shown in Table 3.
Table 3. Wind-Speed Modeling and Land Use
| Land use | MAD (m/s) | MAD (%) | STDEV (%) | N |
| Grass / Shrub | 0.160 | 2.00 | 2.89 | 423 |
| Forest | 0.206 | 2.83 | 3.97 | 82 |
Accuracy data were separated between forest and grassland/shrubland. The dominant land-use category was determined by client information and satellite imagery analysis.
Model Wind-Speed Accuracy: USA vs Brazil
The ArcVera Numerical Modeling System shows consistent accuracy globally, as demonstrated by the comparable results in wind-speed accuracy in both the USA and Brazil, as shown in Table 4. Only data in complex terrain were used for the analysis. Complex terrain is defined as topographic elevation variation of more than 75 meters.
Table 4. Model Wind-Speed Accuracy in the USA vs. Brazil, Complex Terrain
| Country | MAD (m/s) | MAD (%) | STDEV (%) | N |
| USA | 0.216 | 3.011 | 3.87 | 82 |
| Brazil | 0.239 | 2.921 | 4.09 | 95 |
ArcVera’s Mesoscale-Modeling Expertise
Combined with 40+ years of experience siting wind farms in complex meteorological situations around the world, ArcVera’s in‐house NWP expertise (over 30 years’ experience) allows for an intimate understanding of the capabilities and limitations of mesoscale and other modeling types in application to wind energy. ArcVera’s NWP knowledge and experience also provide the technical expertise to develop and routinely execute cutting‐edge mesoscale-modeling techniques for applications to wind energy.
Thanks to ArcVera’s years of experience, ArcVera has successfully deployed and executed an advanced high-resolution mesoscale-modeling platform, which:
- Uses the state‐of‐the‐science Weather Research and Forecasting (“WRF” or “WRF-LES model”) (http://www.wrf‐model.org/index.php),
- simulates the winds customized for the unique characteristics of a given wind-energy sites at meteorologically and wind-energy-appropriate grid resolutions (typically 200 m), and
- is priced competitively and delivered efficiently (3 weeks or less for all but very large
projects or unusual applications).
The ArcVera high-resolution mesoscale-modeling system is applied for the main purpose of increasing wind-energy project value; the modeling system achieves this by creating high-fidelity long‐term average annual hub‐height wind-speed maps and turbine‐by‐turbine hub‐height wind-speed estimates. This method improves turbine‐by‐turbine long‐term mean wind-speed estimates and decreases wind-flow-modeling uncertainty, resulting in improved P‐Values. Examples of the improved wind-speed maps are shown above in Figures 1, 2, 3, and 4.
ArcVera generally applies the high-resolution mesoscale model as early as possible in the development cycle, with bias-correction only after having acquired nearly one full year of wind data from at least one meteorological tower. Additional meteorological measurement locations are necessary for obtaining the full value for reducing uncertainty, improving P‐values, enabling independent “data‐denial” verification, and validating the model results. A data‐denial study uses the data from one meteorological tower, rather than all of the meteorological towers, to inform a bias correction to the entire modeled area.
Alternatively, a comparison between a linearly bias-corrected wind map and the long-term mean annual hub-height wind speeds at the meteorological tower locations can be used to assess wind-map accuracy and wind-speed standard deviation. Occasionally, ArcVera will also run the high-resolution mesoscale model for virtual meteorological towers, large-scale wind mapping (e.g., country-sized or for prospecting larger areas), or to investigate isolated wind phenomena or other custom purposes as needed by clients.
Conclusion
Mesoscale models are much more capable than linear models of producing detailed wind-resource maps of project areas. For optimal results, mesoscale modeling should be performed at horizontal grid resolutions of 300 m, 200 m, or less before downscaling, as early as possible in the development cycle.
However, it is most often performed at much larger coarse grid resolutions before being downscaled. While the downscaled map is still superior to that of linear models, the raw model results can be inaccurate and the wind-speed results are based on physics from the pre-downscaled resolution simulation.
ArcVera’s proprietary high-resolution mesoscale-modeling technique eliminates such risks by modeling with full atmospheric physics with wind flows at sub‐100 m scales; ArcVera usually uses 200-m grid spacing before downscaling to a 30-m wind-map resolution. This technique also addresses the particular topographic, geographic, and meteorological characteristics of each individual site.
By using high-resolution grid spacing and custom designing the model to a client’s specific site, ArcVera’s high-resolution mesoscale-modeling technique is consistently able to reduce micrositing uncertainty and determine the accurate long-term wind-flow patterns across any given project, optimizing measurement campaign design and landowner targeting, optimal turbine siting, increasing the likelihood of lifetime performance and de-risk returns, improving investor confidence, and ultimately increasing the value of each wind-energy project.
Given its direct application to early development and financing, the simulation need only be run once for a project lifetime of benefits to wind energy projects.
ArcVera authors
Greg Poulos, CEO and Principal Atmospheric Scientist
Mark Stoelinga, MS, Senior Meteorologist


