Download our India solar anomaly map for October 2021
India – Solar Anomaly Map – October 2021
Prev
 0
0
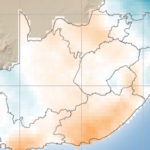
South Africa – Solar Anomaly Map – October 2021
03 November 2021
Next
 0
0
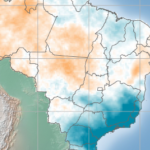
Brazil – Solar Anomaly Map – October 2021
03 November 2021
Need a deeper investigation
of your production anomalies?
of your production anomalies?
Numerous valuable resource and production options:
- Quarterly, Year-to-date, Annual, Custom periods
- Project specific anomalies?
- Production anomalies in addition to resource anomalies
- Estimated production anomalies based on energy
sensitivity to resource - Production forensics for detailed attribution
of production anomaly causes
- Estimated production anomalies based on energy
Get in touch with us now at David.Simkins@ArcVera.com
for more information!
Subscribe now to receive email notifications
when new maps are uploaded
when new maps are uploaded
*required fields
For Business Inquiries

Adam Smith
Business Development Manager
+1 281-986-1300